Performance insights report (Beta)
The performance insights report highlights bottlenecks, including RDU versus Host, critical sections, and critical stages. It also provides initial steps for conducting a deeper analysis of issues.
Locate the report
The performance insights report is available in .JSON format at the following location in your output folder:
/reports/analysis/summary.json.
Read the report
{
"Overview": [
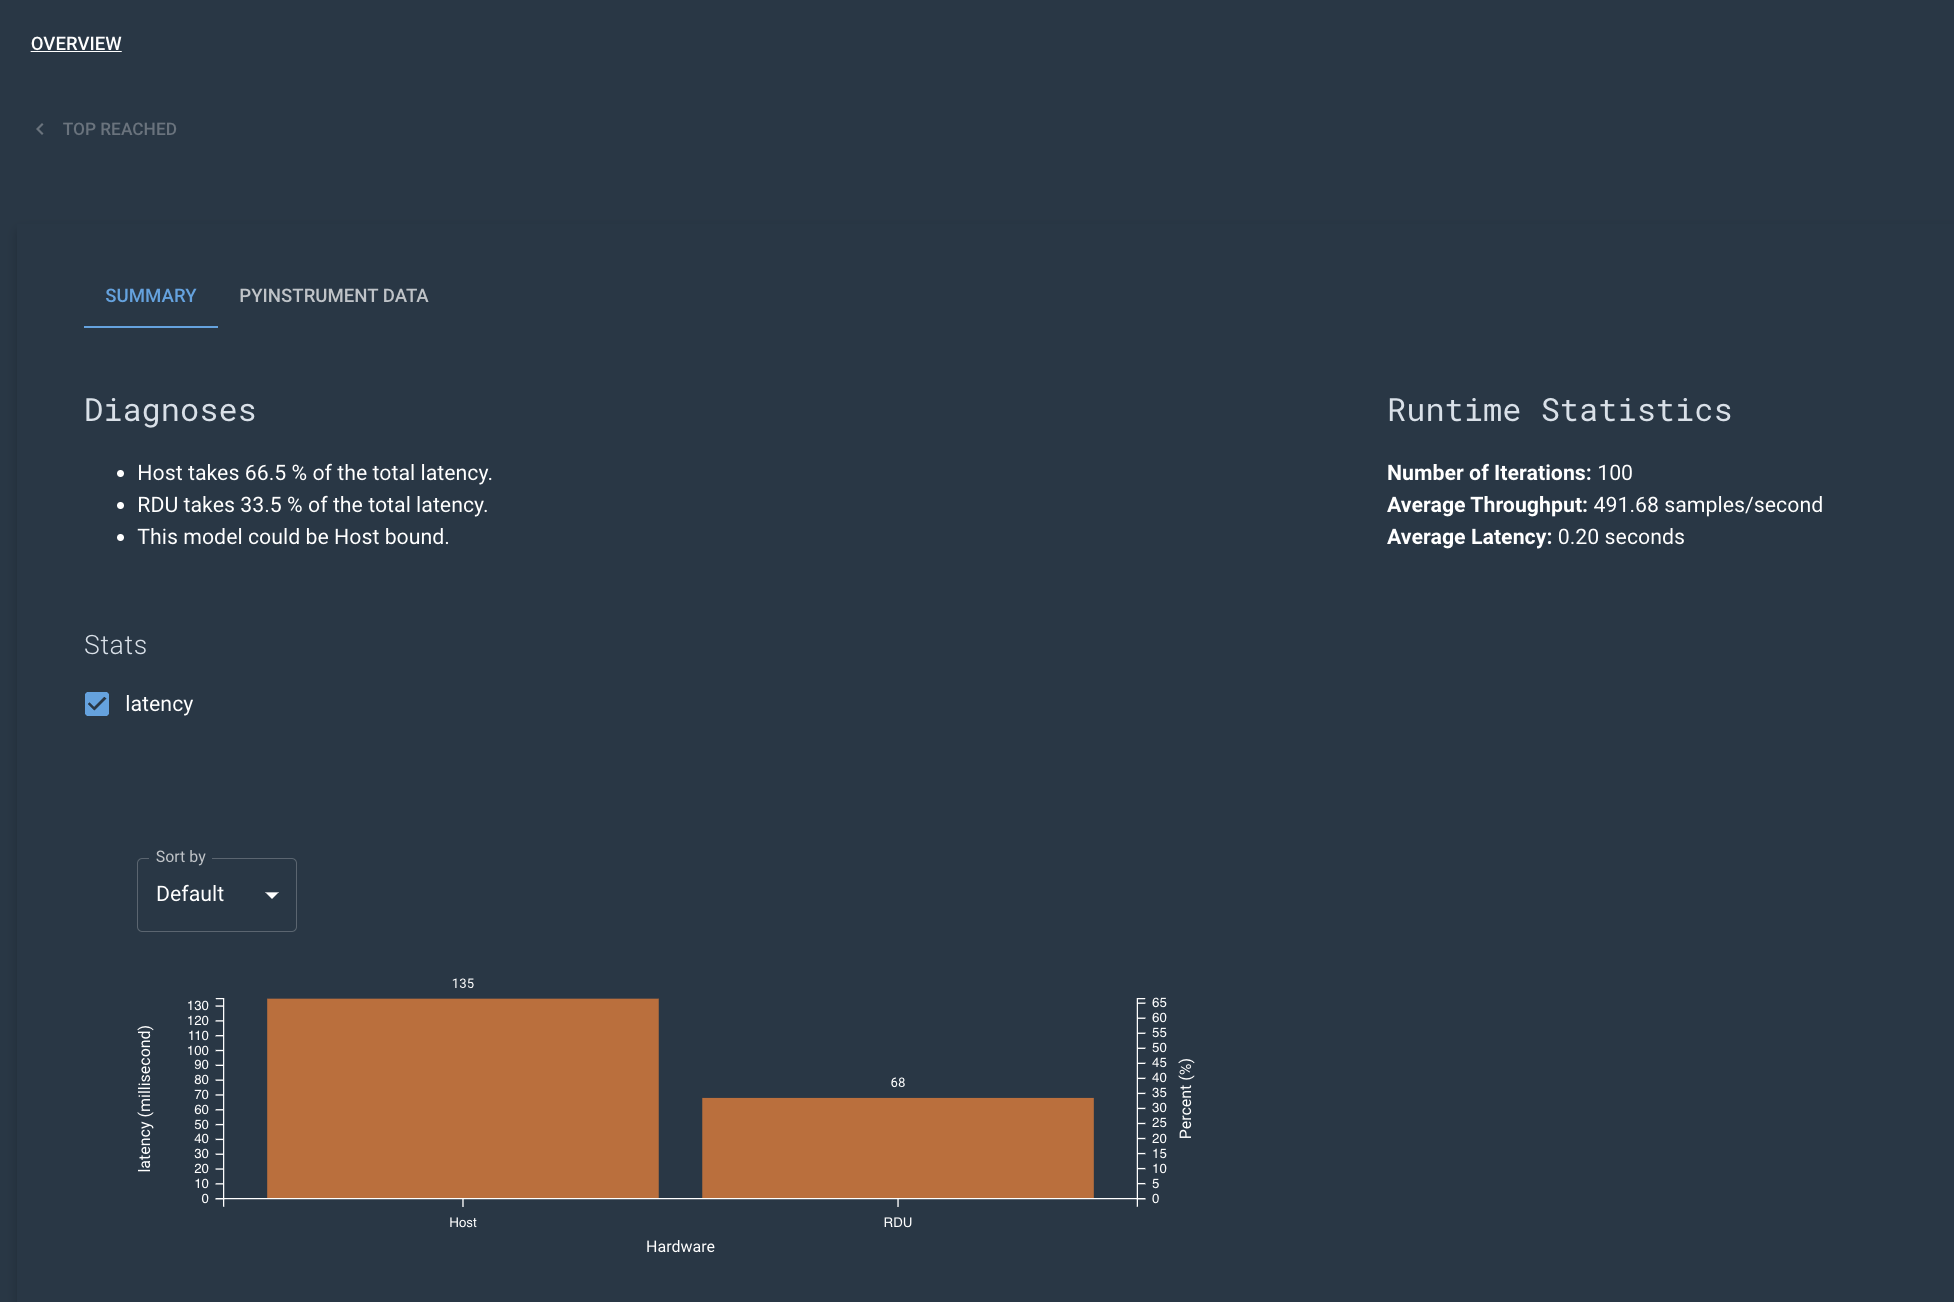
"Host takes 66.5 % of the total latency.",
"RDU takes 33.5 % of the total latency.",
"This model could be Host bound."
],
"Host": [
{
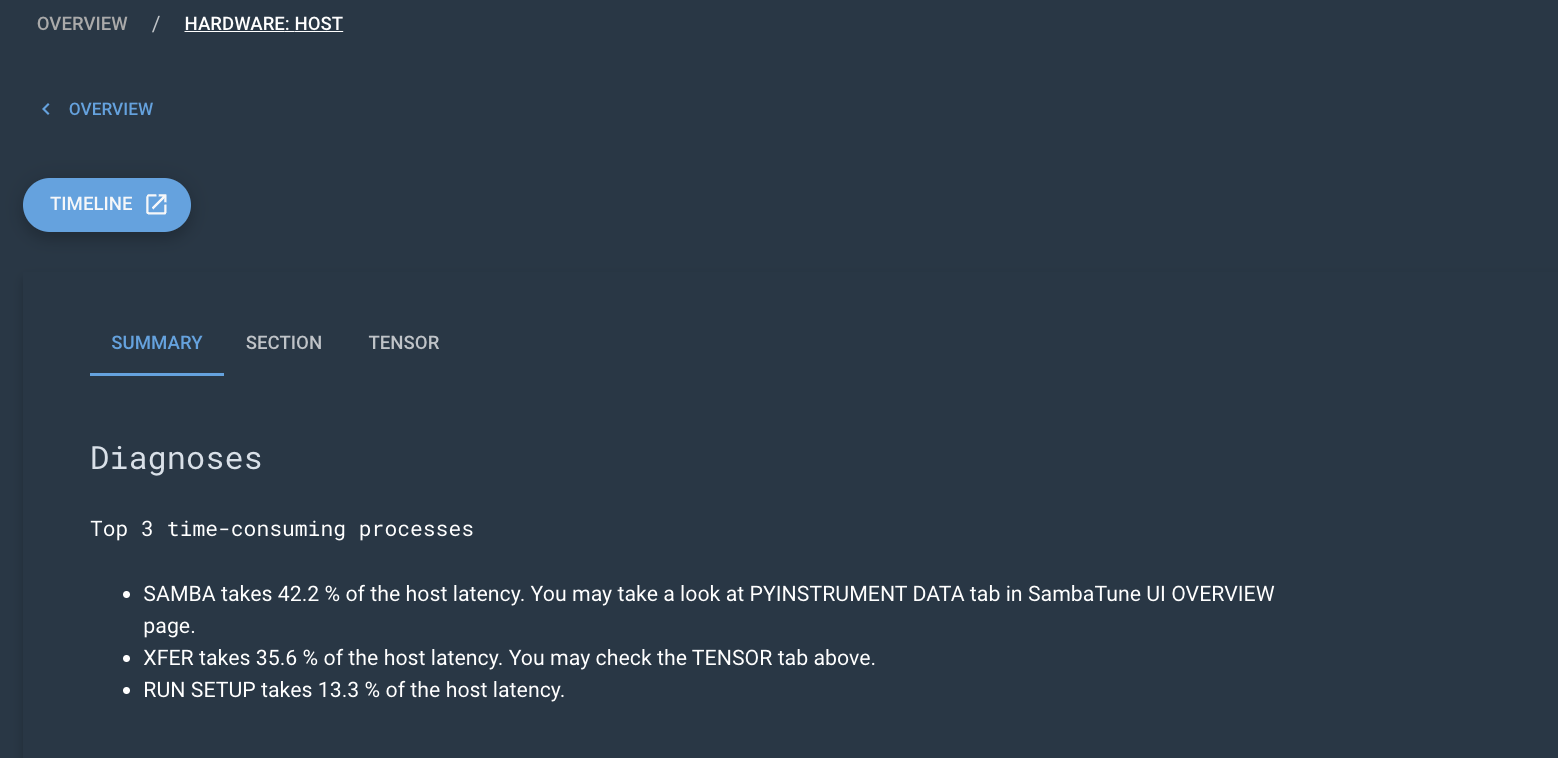
"Top 3 time-consuming processes": [
"SAMBA takes 42.2 % of the host latency. You may take a look at PYINSTRUMENT DATA tab in SambaTune UI OVERVIEW page.",
"XFER takes 35.6 % of the host latency. You may check tensors in <path_to_report>.",
"RUN SETUP takes 13.3 % of the host latency."
]
}
],
"RDU": [
{
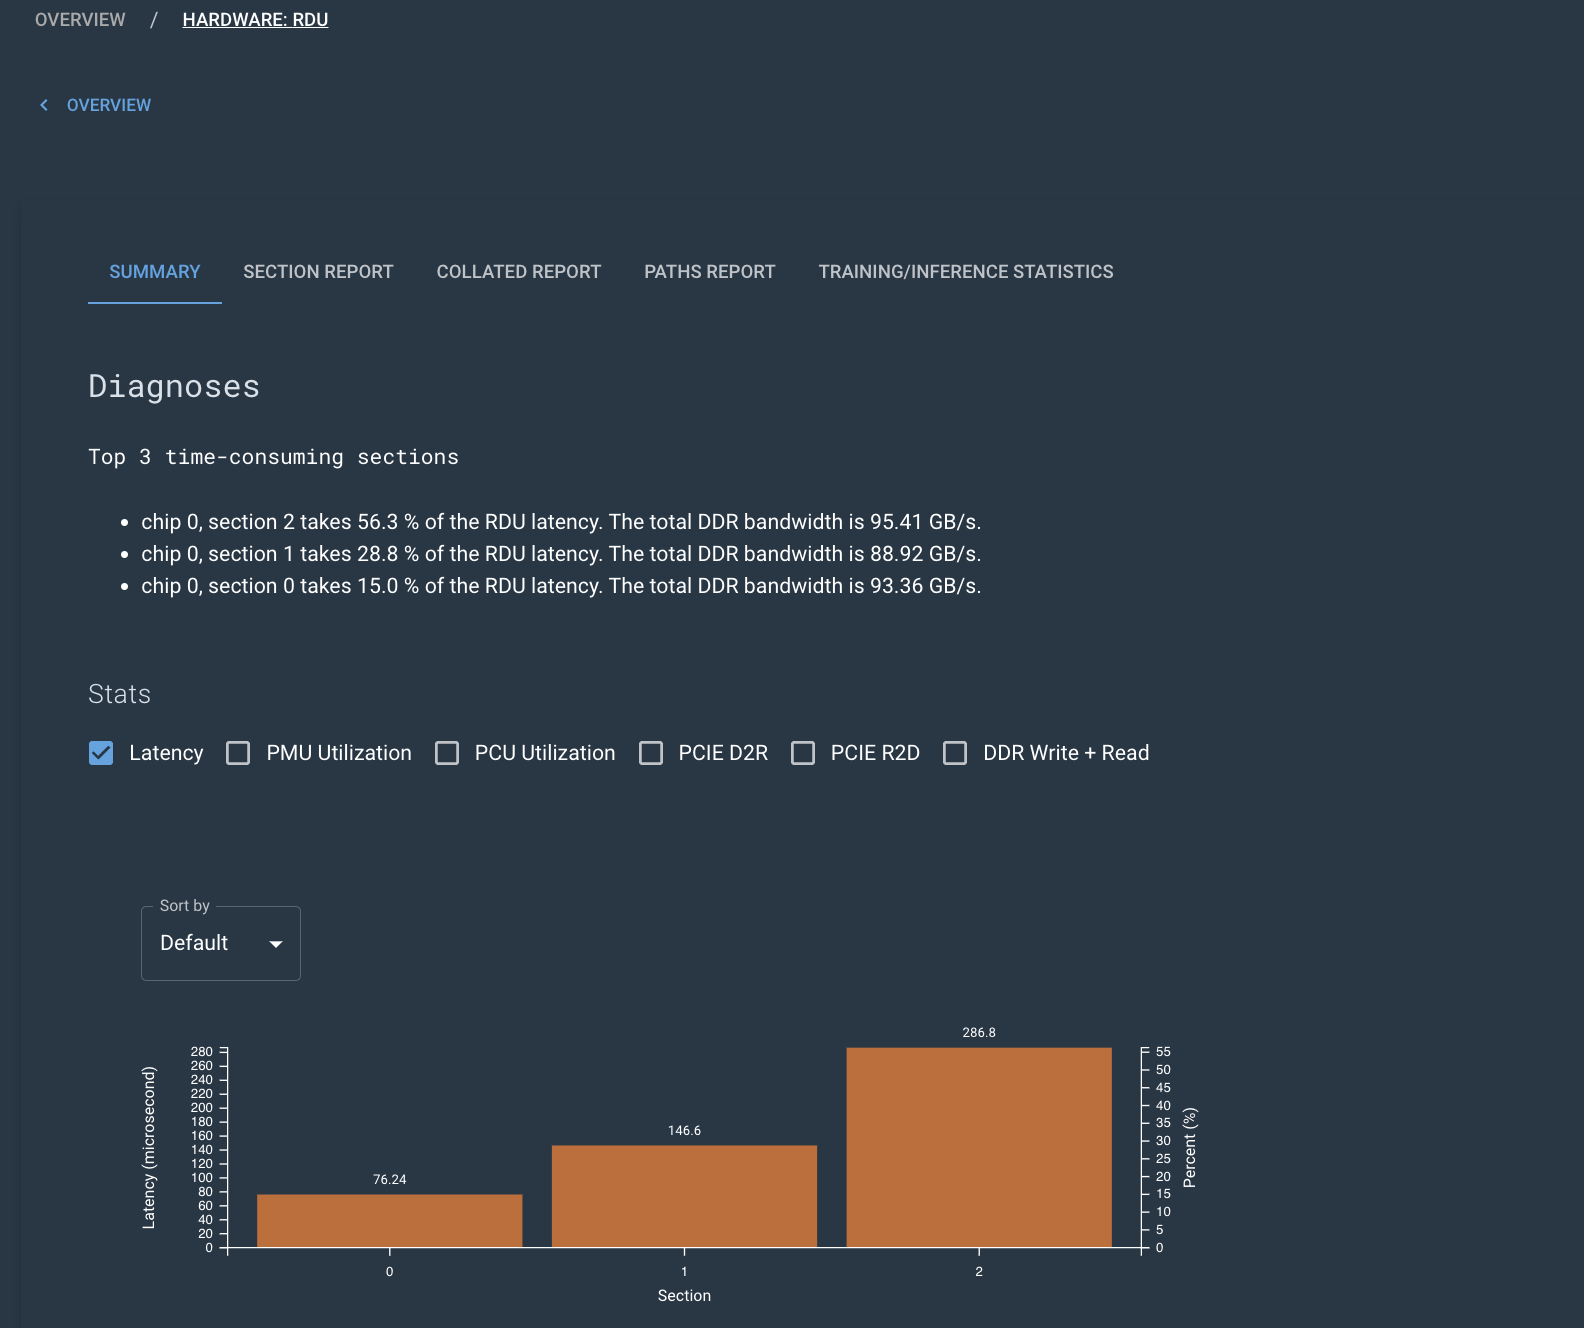
"chip 0, section 2 takes 56.3 % of the RDU latency. The total DDR bandwidth is 95.41 GB/s.": {
"Analysis": [
"Detailed information can be found in <path_to_report>."
],
"Top 3 time-consuming stages": [
"Detailed information can be found in <path_to_report>."
]
}
},
{
"chip 0, section 1 takes 28.8 % of the RDU latency. The total DDR bandwidth is 88.92 GB/s.": {
"Analysis": [
"Detailed information can be found in <path_to_report>."
],
"Top 3 time-consuming stages": [
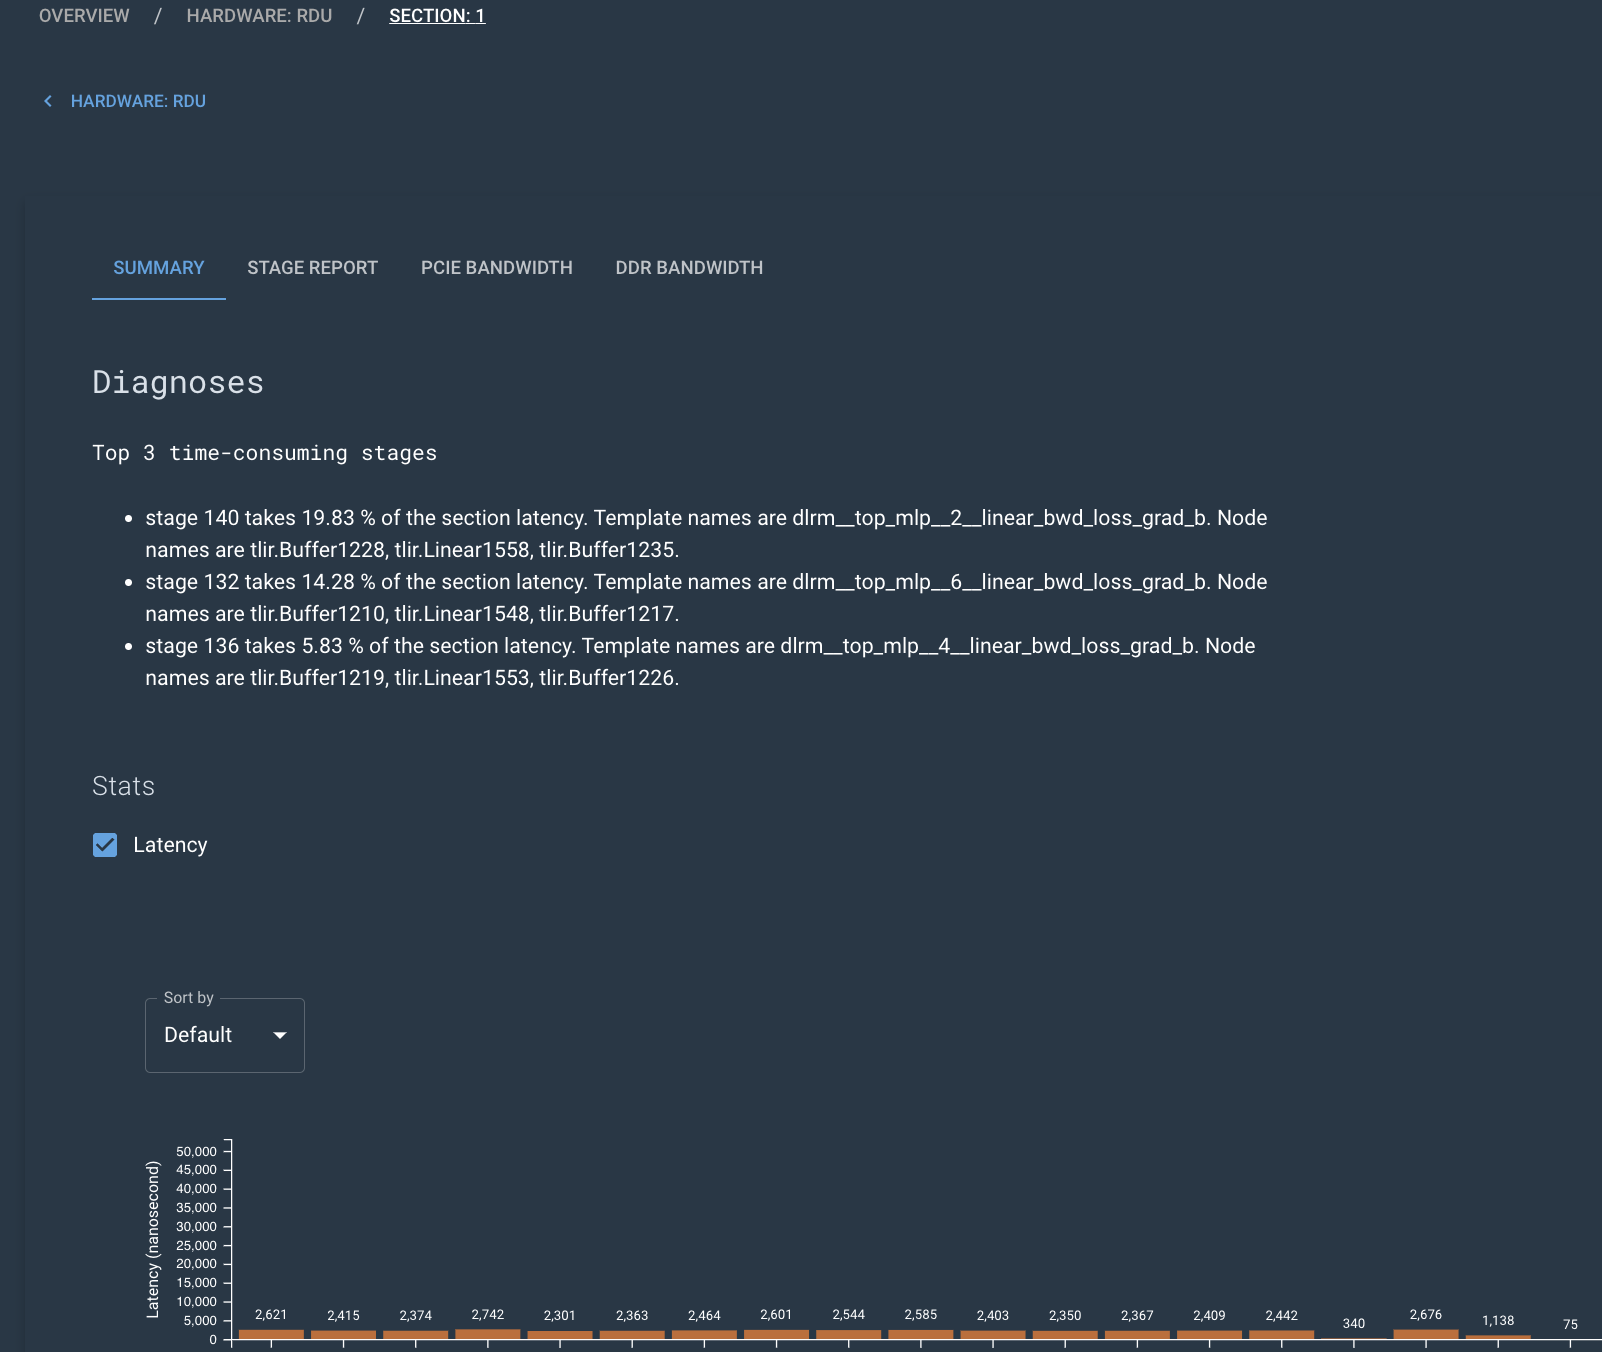
"stage 140 takes 19.83 % of the section latency. Template names are dlrm__top_mlp__2__linear_bwd_loss_grad_b. Node names are tlir.Buffer1228, tlir.Linear1558, tlir.Buffer1235.",
"stage 132 takes 14.28 % of the section latency. Template names are dlrm__top_mlp__6__linear_bwd_loss_grad_b. Node names are tlir.Buffer1210, tlir.Linear1548, tlir.Buffer1217.",
"stage 136 takes 5.83 % of the section latency. Template names are dlrm__top_mlp__4__linear_bwd_loss_grad_b. Node names are tlir.Buffer1219, tlir.Linear1553, tlir.Buffer1226.",
"Detailed information can be found in <path_to_report>."
]
}
},
{
"chip 0, section 0 takes 15.0 % of the RDU latency. The total DDR bandwidth is 93.36 GB/s.": {
"Analysis": [
"Detailed information can be found in <path_to_report>."
],
"Top 3 time-consuming stages": [
"stage 18 takes 3.72 % of the section latency. Node names are tlir.Buffer950, tlir.Buffer967.",
"stage 3 takes 3.72 % of the section latency. Node names are tlir.Buffer965, tlir.Buffer967.",
"stage 25 takes 3.72 % of the section latency. Node names are tlir.Buffer943, tlir.Buffer967.",
"Detailed information can be found in <path_to_report>."
]
}
}
]
}
The report is structured into three parts: Overview, Host, and RDU.
-
The Overview presents the percentage of time consumed by Host and RDU and identifies potential bottlenecks.
-
The Host section presents the top 3 time-consuming processes, expressed as a percentage of total Host latency. The section offers suggestions such as using pyinstrument, the standard call-stack profiler in Python, or using tensor data.
-
The RDU section presents the top 3 time-consuming sections and their total DDR bandwidth. For each section, it shows analysis and top 3 time-consuming stages as well as their template names and node names.